Today we are going to be talking about a cool offering from the folks over at Thundra called, Online Debugging. They’ve built something that is pretty interesting and I think everyone working in the serverless space will be excited to experiment with it.
High level summary
- Setup a Thundra account
- Thundra onboarding
- Build our AWS Lambda function
- Setup the AWS Lambda function
- Setup the Thundra VSCode plugin
- Online debugging
- Final Thoughts
Set up a Thundra account
The first thing we need to do is sign up for a Thundra account.
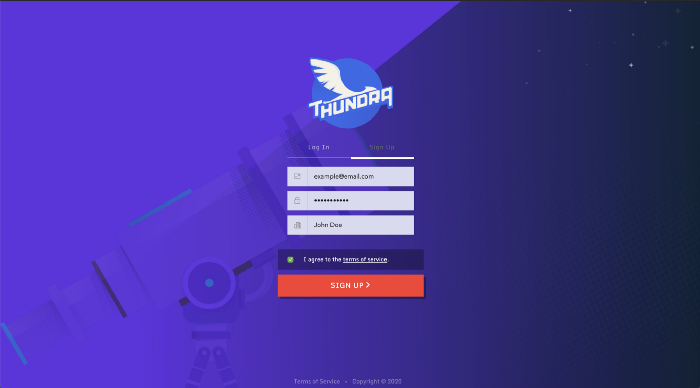
Then we can log in and get rolling.

Thundra onboarding
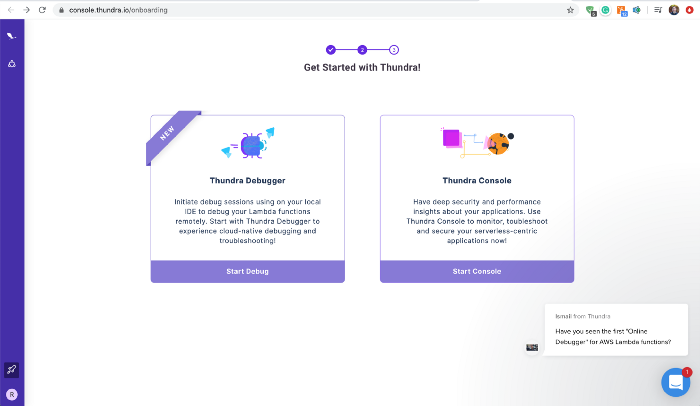
There are two paths when getting set up with Thundra, the pre-existing option is the Thundra Console and the new addition that this article is covering is the Thundra Debugger. Select Thundra Debugger.
Now we are prompted with an authentication key and a series of steps we need to follow to get the VSCode plugin setup.
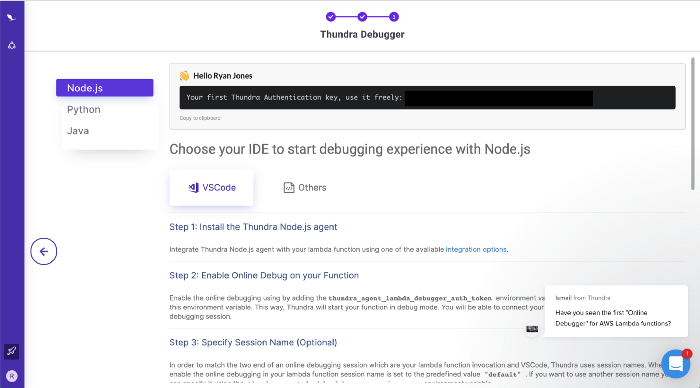
The first step is to install the Thundra Node.js agent which we are going to walkthrough below.
Build the AWS Lambda function
Typically an AWS Lambda function only requires a handful of files, especially when working with NodeJS.
Below we are creating our initial files and installing the @thundra/core npm dependency.
$: mkdir debugging
$: cd debugging
$: npm init -y
$: npm install --save @thundra/core
$: touch index.js
Now we can write our index.js file which will hold our business logic.
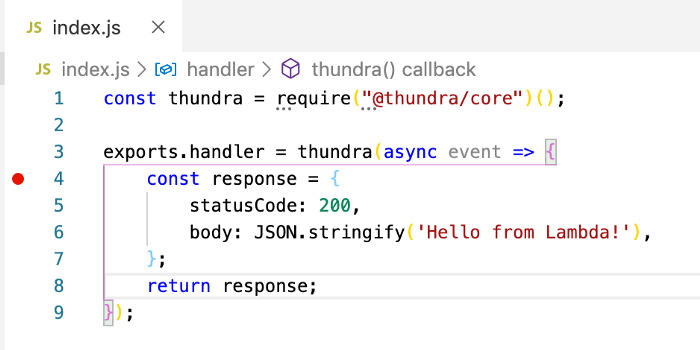
// index.js
const thundra = require("@thundra/core")();
exports.handler = thundra(async event => {
    const response = {
        statusCode: 200,
        body: JSON.stringify('Hello from Lambda!'),
    };
    return response;
});
At the top, you can see that we are importing the @thundra/core dependency and then wrapping our exports.handler function code with the @thundra/core dependency. This wrapper code will connect all of our AWS Lambda executions back to the Thundra platform.
Once we have our function code updated, we need to zip the required AWS Lambda files. Then we can move to the AWS console.
$: zip function.zip index.js package.json node_modules -r
Setup the AWS Lambda function
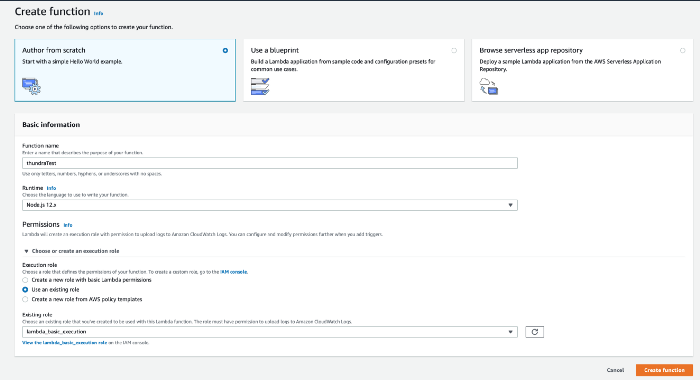
Now that we have our AWS Lambda zip file ready to upload. We can navigate to the AWS Lambda console and create a function.

Now we need to configure some details such as naming (thundraTest), setting up our runtime (NodeJS 12.x), and our AWS IAM role (lambda_basic_execution).
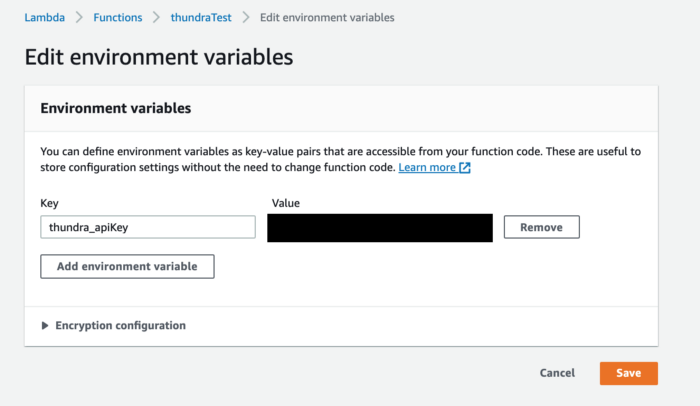
Once our AWS Lambda function is created we need to configure two environment variables:
- thundra_apiKey — during onboarding choose “Thundra Console” and you should see this value (optional)
- thundra_agent_lambda_debugger_auth_token — during onboarding choose “Thundra Debugging” and you should see this value
Now it’s time to upload our AWS Lambda zip file from our previous steps.
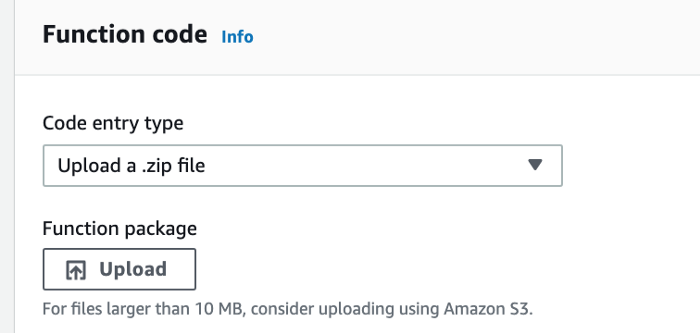
Once the zip file is uploaded we can now test our function.

Once we hit Test we should see the following result.

Once you have the AWS Lambda function successfully returning a 200 response. We then need to set up the VSCode plugin.
Setup the Thundra VSCode plugin
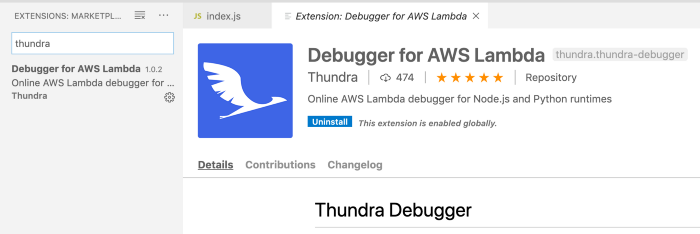
The first thing we need to do is simply install the Thundra VSCode plugin.
Next, we need to create a local file to authenticate our VSCode with our Thundra account.
$: touch debug-client.json
Now we need to set up the file by replacing <set-your-thundra-auth-token> with our Thundra auth token.
{
    "profiles": {
        "default": {
            "debugger": {
                "authToken": <set-your-thundra-auth-token>,
                "sessionName": "default",
                "brokerHost": "debug.thundra.io",
                "brokerPort": 443
            }
        }
    }
}
Now that the VSCode plugin is set up locally. We need to add another environment variable, thundra_agent_lambda_debugger_auth_token, to our deployed AWS Lambda function.
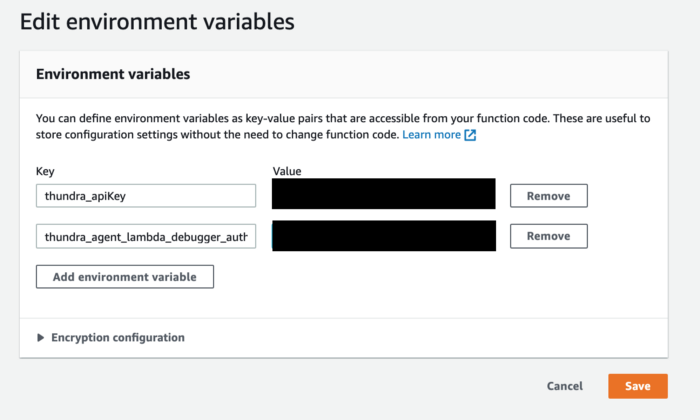
This extra environment variable will now cause our AWS Lambda function to connect to our VSCode environment.
Let’s take a look at using Thundra online debugging.
Online debugging with VSCode
Online debugging allows a developer to set breakpoints on live deployed AWS Lambda functions. To get this setup we need to walk through a couple of steps.
- Place breakpoints in your local code
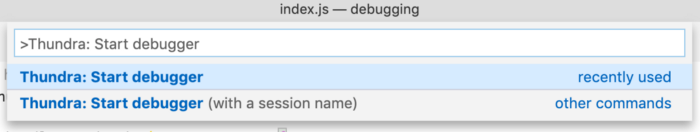
- Run the Thundra: Start Debugger command
- Run your AWS Lambda function in the AWS Console
After the AWS Lambda function executes, you can step through each breakpoint and see the variables side-by-side.
First off we need to set breakpoints in our code. I’m just setting the breakpoint underneath the event.
Then we need to start the debugger inside VSCode.
Then we need to switch back to the AWS console and invoke our AWS Lambda function.

Make sure that you set the timeout pretty high on the function that you’re debugging. When you run the AWS Lambda function and it connects to VSCode it’s only open for a limited window. That window is whatever you set the AWS Lambda timeout too. If you set the timeout to 30 seconds, then you can only play around with the VSCode Online debugger for 30 seconds before it breaks. Based on the size of your AWS Lambda function you might want to have a timeout of a few minutes if you need additional time to process what values are being populated.
And once the connection is made, we should be able to step through our breakpoints one-by-one and debug those values.

As you can see above the side panel is populated with variables from our live AWS Lambda function and you can see the event object had our test event we made previously when setting up the AWS Lambda function in the AWS console.
Final Thoughts
Overall I think the Thundra Online debugger is a powerful solution for developers looking to avoid emulating the cloud locally. By using the VSCode plugin you are utilizing real AWS resources and you’re able to debug a live deployed AWS Lambda function via breakpoints without needing to redeploy any code.
If you have any questions on the content covered, please comment below.


%20(1).svg)

.svg)