Lumigo is a platform that primarily focuses on debugging distributed serverless applications on the AWS cloud. Services like X-ray from AWS do a pretty good job at tracing requests with your application but the support for event driven systems isn’t quite there yet. X-ray also falls short in terms of piecing up fragments of certain chained transactions inside serverless architectures because that requires you to navigate between Cloudwatch and X-ray to understand individual events.
Distributed applications are inherently complex, and because of that complexity, they have multiple points of failure. By tracing each and every request with respect to your functions, Lumigo aims to alleviate the process of finding faults and figuring out fixes when breakdowns occur in your serverless architecture. In addition to analyzing code issues and performance hiccups, Lumigo’s insights will allow you to plan the operational limits for your functions based on your usage, providing you a foundation to optimize costs. With Lumigo’s alerts, averting an impending system failure becomes possible as long as the right course of action is taken based on the insights.
We’ll explore how the platform works with a simple lambda function that converts an audio file to text using the AWS Transcribe service.
Initial Setup:
To start using Lumigo, all you need to do is allow cloudformation to deploy cloudformation stack into your AWS account. Once the stack is deployed, you can select all the lambda functions you want Lumigo to automatically begin tracing.

Lumigo’s auto-tracing works by adding a lambda layer and environment variables to your lambda function. In the unlikely event that you need to trace functions on your own, follow their documentation from here.
Creating the Lambda Function:
For understanding the platform, deploy a lambda function using the following python code.
Lambda_function.py
import json
import urllib.parse
import boto3


def lambda_handler(event, context):
  bucket = event['Records'][0]['s3']['bucket']['name']
  key = urllib.parse.unquote_plus(event['Records'][0]['s3']['object']['key'], encoding='utf-8')
  print(bucket)
  print(key)
  s3 = boto3.client('s3')
  s3_audio_file = s3.get_object(Bucket=bucket, Key=key)

  try:
    transcribe = boto3.client('transcribe')
    response = transcribe.start_transcription_job(
      TranscriptionJobName=key,
      LanguageCode='es-US',
      MediaFormat='mp3',
      Media={'MediaFileUri':"s3://{bucket}/{key}".format(bucket=bucket,key=key)},
      OutputBucketName='<BUCKETNAME_TO_STORE_TEXT>')
    print("printing transcribe")
    print(response)

    return {
      'statusCode': 200,
      'body': json.dumps('Audio transcribed!')
    }

  except Exception as e:
    print(e)
    raise e
After the function has been created, provide full permissions (this is only for this sample application, as a general practice, only provide permissions for the intended use) for S3 and transcribe services to the associated function role.
This function essentially gets invoked whenever an audio file (.mp3) is uploaded into an S3 bucket. The file’s content is converted to text by calling the AWS Transcribe service. The transcribe service stores the output into another S3 bucket.
Create an S3 bucket that will act as the trigger for this function and associate it from the function’s console view. Create another bucket to store the output from the transcribe service. Add this bucket’s name to the above code block where indicated. (ensure that both buckets are created in the same region as the function)
Getting to Know Lumigo:
The dashboard view displays all those functions that Lumigo has picked up from your account.
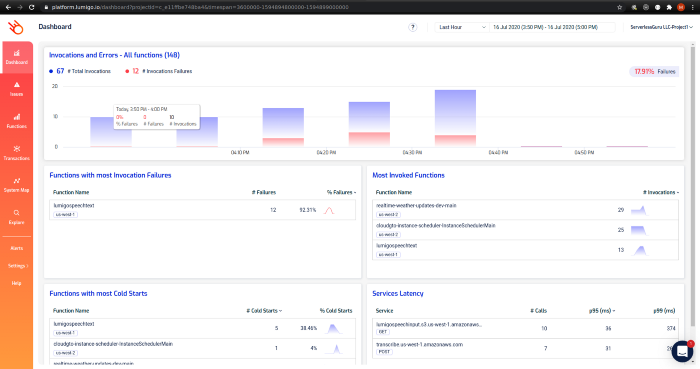
Before we take a look at other screens, upload an .mp3 file to your previously created input bucket. (Some deliberate erroneous invocations were done for sample data)
Navigate from left pane Functions -> filter your created function.
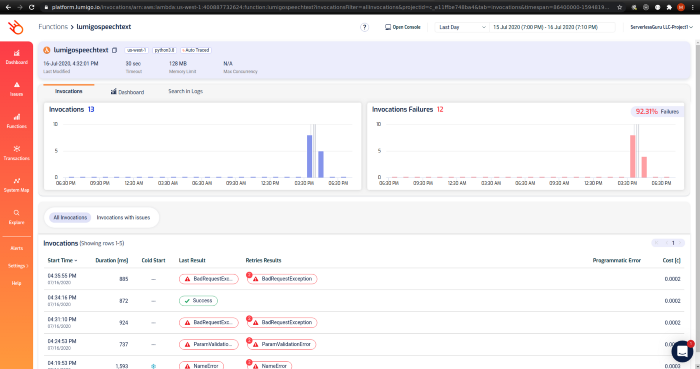
Function view: This view gives you a high-level overview of how your function is performing and the cost per invocation. Clicking on any on the invocation will navigate to the transaction page to understand what went on in that particular trace.
If you haven’t enabled Lumigo to begin function tracing yet, the process is as simple as hitting Auto trace from the top of the screen. (since I have already traced this function that button is invisible)
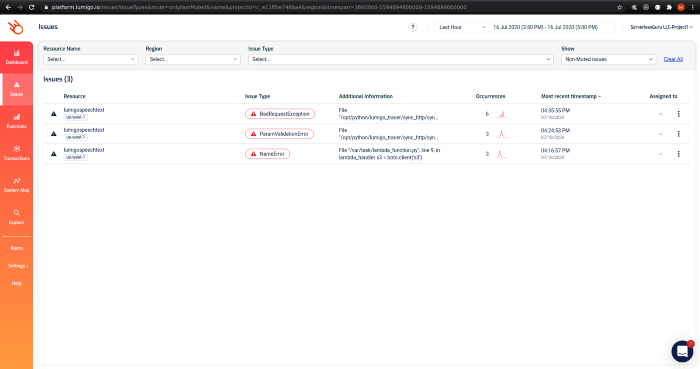
Issues view: This view shows all issues your functions are facing in the account. Selecting any issue type will open up the function view as above filtered with the chosen issue type. From those entries, you can then view each of those transactions individually and the course of that invocation.
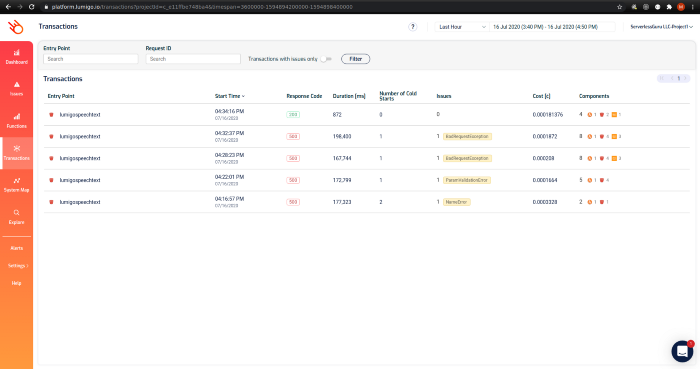
Transaction view: This view lists all invocations of your functions and their metrics. I have filtered with our speech-to-text function to understand what went wrong and get a pulse as to why the invocations are failing to produce the expected result. Notice how each failed entry has an attached label indicating the cause of failure. Selecting any of the entries goes to the transaction view below.
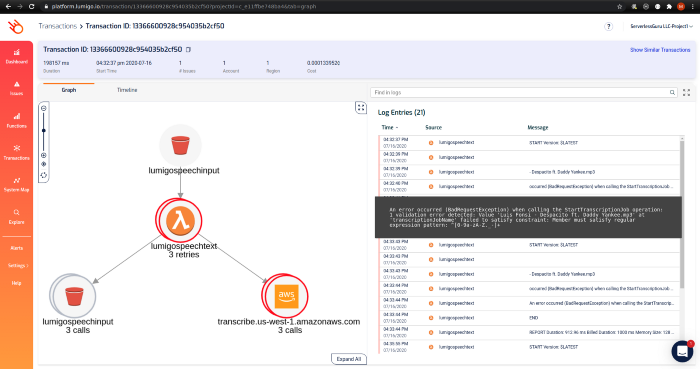
Transaction ID view: This view is where you truly get to know what Lumigo is capable of. From the log entries, it’s evident that the cause of failure is the filename not conforming to a pattern accepted by the transcribe service.
This is the view that Lumigo connects to other views, which we have already looked at when you are troubleshooting issues individually for each function call.
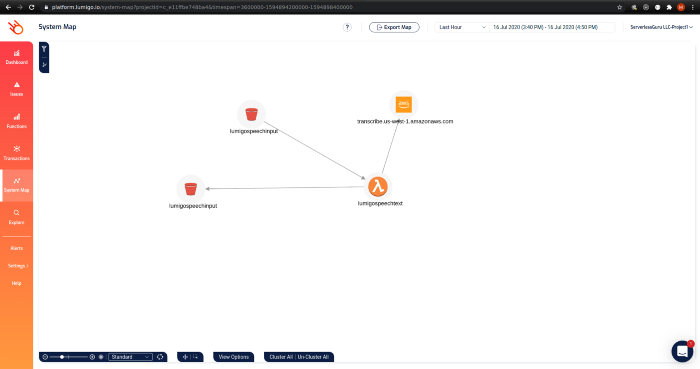
System map view: Once an invocation occurs, the service map view lets you visualize the services involved in an invocation call. This is very useful when you have extensive integrations with third-party services and need to see how an invocation trace flows between those services.
Conclusion:
We’ve explored how simple and easy it is to begin tracing lambda functions on Lumigo. The console is intuitive with each screen blending in with one another for correlating metrics. There are also provisions to set up alerts for your functions so you can keep a close eye on them and fine-tune them depending on how frequently those alerts pop up. Alert notifications can be received by popular PagerDuty, Slack, and OpsGenie to name a few. Tracking issues for better visibility can be done by opening Jira tickets from Lumigo. With Lumigo offering a complete package for serverless debugging and performance monitoring as a service with their nimble approach, it makes them a compelling choice to consider when looking for a monitoring solution.


%20(1).svg)

.svg)