When developing serverless applications, it's best to debug in the cloud as much as possible. You can never emulate 1:1 what is in your local environment compared to the cloud.
This is a little bit of a different mindset compared to monolith or containerized applications where you are able to test it 100% locally. This doesn't mean that you cannot run certain things offline. Offline functionality can work for a small-scale application with just a DB and a CRUD logic running in Lambda.
If you add additional services like SNS, SQS, SES, EventBridge, etc., you cannot simply run the application and click around. You will have to emulate those services with the libraries like the localstack or similar modules that emulate cloud infrastructure.
Serverless application testing relies on unit, integration, and E2E test running on the Cloud environment. There is nothing super weird about it, considering all the challenges distributed architecture provides.
If you are developing in the AWS Cloud, you are most likely using Infrastructure as Code to deploy your application. We can think about CloudFormation as a machine language and CDK as an assembly, while the frameworks like Architect, Serverless, and SAM are higher-level languages.
I will show you how to set up a VSCode debugger for the Serverless and SAM framework.
Debugging SAM Application
In this scenario, we will create standard nodejs16.x hello-world example using `sam init` command.
Now, open the project in Visual Studio Code. To make our life easier, we will install the AWS Toolkit extension. If you already have it, then you can skip this step. Install YAML extension by RedHat. If you don’t have a YAML extension, you will most likely be unable to see the “Add debug configuration” option above the function you want to debug.
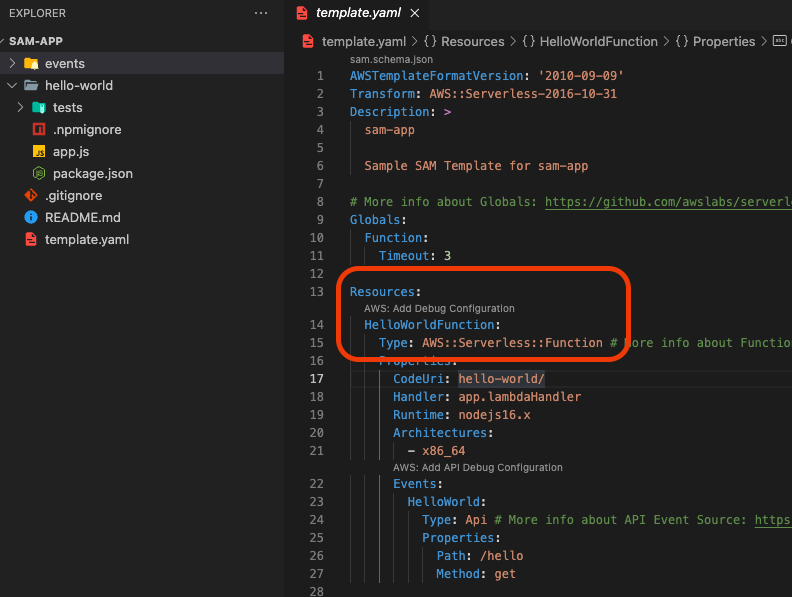
Launch configuration in VSCode allows us to configure VSCode integrated debugger. We can add configuration manually, but the AWS Toolkit extension can do this for us. Let’s click on the `AWS: Add Debug Configuration` CodeLens above the function we want to debug. This will create the `.vscode` folder in the project root directory with the `launch.json` configuration file inside.
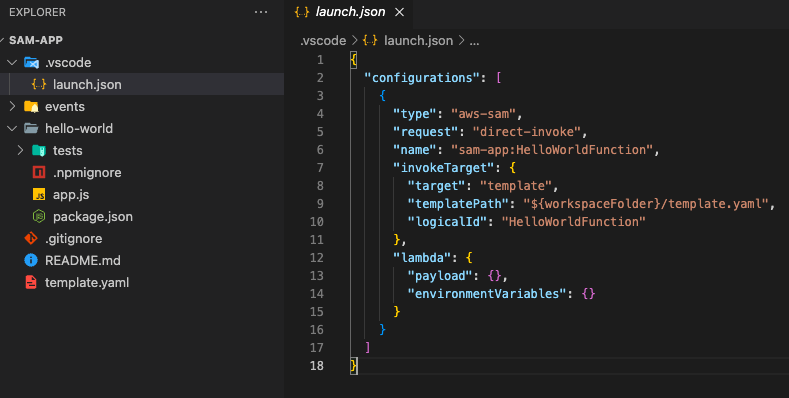
Your launch configuration should look like this:
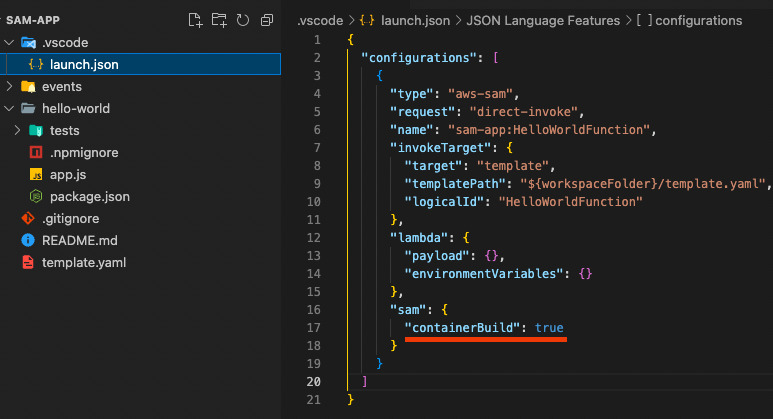
If you are having problems with a build like the one mentioned in this issue, you can set the “containerBuild” attribute value to `true` so your build will use a container and you should be ok. The final version of the `launch.json` configuration may look like this:
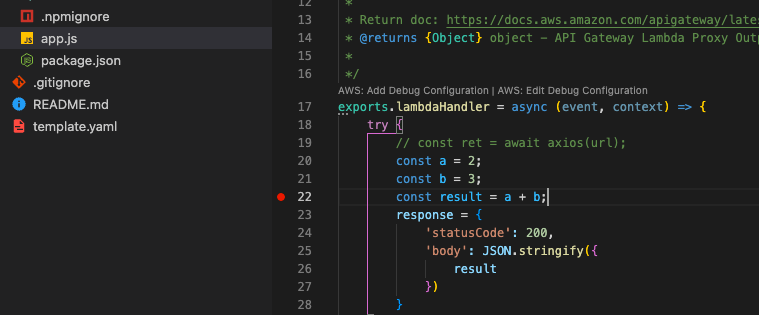
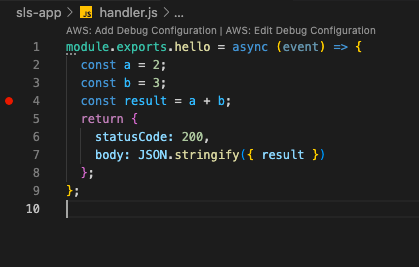
Let’s add a few lines of code to our app.js and set the breakpoint. You can set the breakpoint by simply clicking next to the line number. Notice the red dot. You can add as many breakpoints as you need. When the application reaches that point, it will stop the execution, and you will be able to evaluate current values. Decide on your own when you want to proceed.
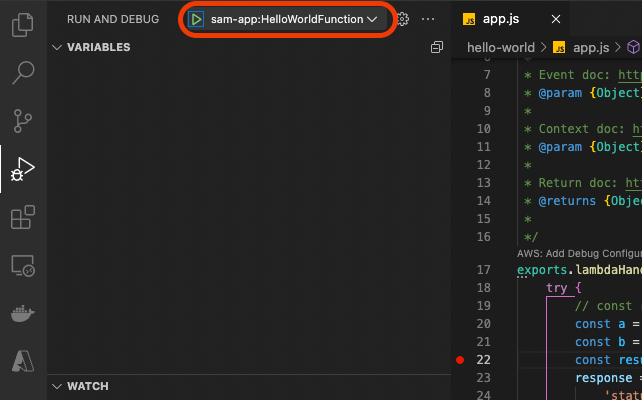
Switch to debugger, then click on the green “play” button next to the configuration.
The application will start executing until the breakpoint when you run the debugger. When it reaches the breakpoint, it will “freeze” and let you evaluate the current state.
You can use the toolbar on the top to continue executing the program, or you can choose to go step by step. If you don’t have debugger experience, I will strongly recommend you experiment and try it on a more complex application.
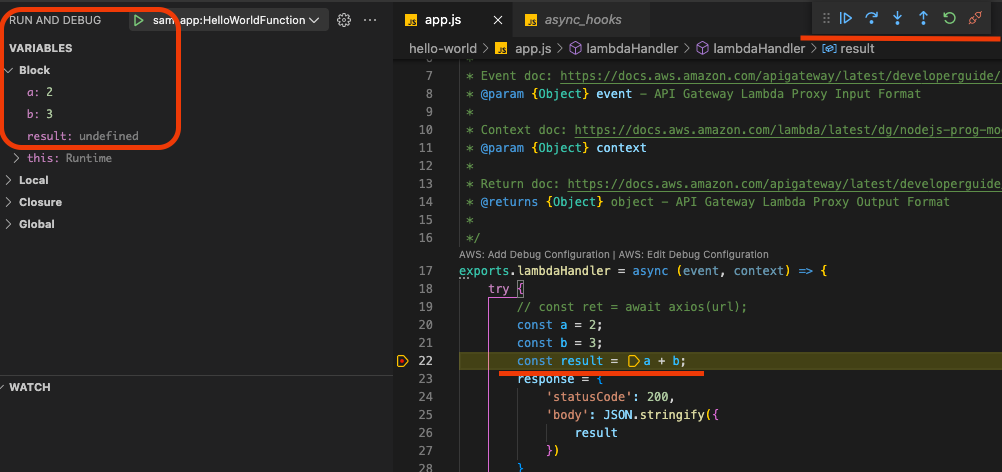
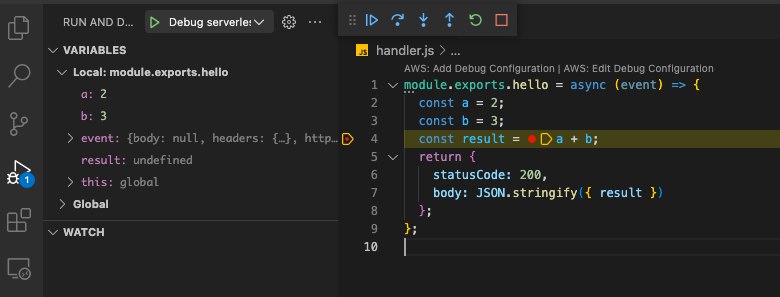
On the left side, you can see current variable values, or you can simply hover with the mouse over the variable in a code to evaluate its current value.
Notice that the result is still undefined since the line where the breakpoint is set has not been executed, which means the expression has not been evaluated yet.
Debugging Serverless Framework Application
We can do the same thing with the Serverless framework. The only difference is that we will create the launch configuration manually. We will need to install the serverless-offline plugin to use our API Gateway endpoints offline. Since we will use serverless CLI from our local node_modules folder, we will also need to add that.
Let’s proceed and create a standard NodeJS application.
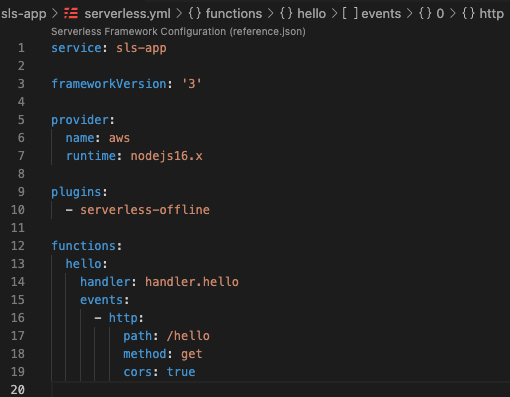
Now, open the project in the VSCode. Let’s add the serverless-offline plugin to our serverless.yml file. I also removed comments, updated runtime to nodejs16.x, and set up the HTTP event trigger. Our serverless.yml file now looks like this:
Let’s add a few lines into the handler.js, similar to the changes we made in a previous SAM example. We can also set the breakpoint right away.
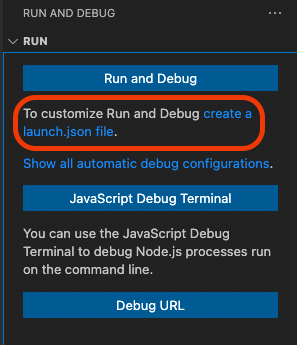
Switch to the debugger and click on the “create launch.json file” then select nodejs from the list.
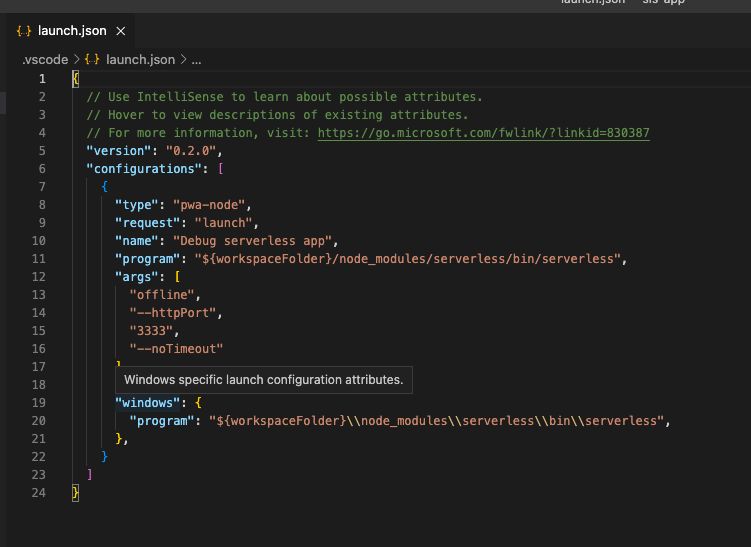
Let’s customize the file to serve our needs:
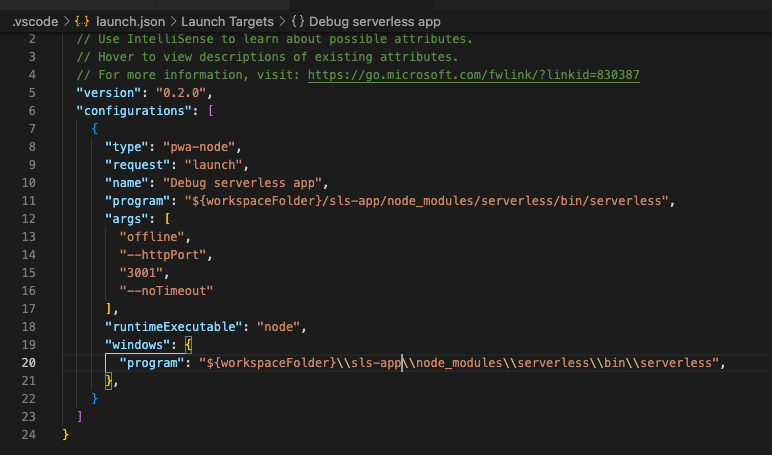
We need to tell the debugger which process we want our module to be attached to. We are using the serverless framework, so we will set the program attribute to point to our local node_modules, where we installed the serverless framework. This will work on Linux and Mac, but Windows is using backslash to separate folders, so we will need to tell the debugger how to find serverless binary on windows. We need to make sure that we start the serverless offline plugin, so we will pass the arguments to our serverless cli.
Notice the “noTimeout” argument that we use to disable timeout for our endpoint. When the program freezes on the breakpoint, we can get an error if we stay there for longer than 30 seconds. That is why this argument is required.
That should be all. Now we can start the debugger.
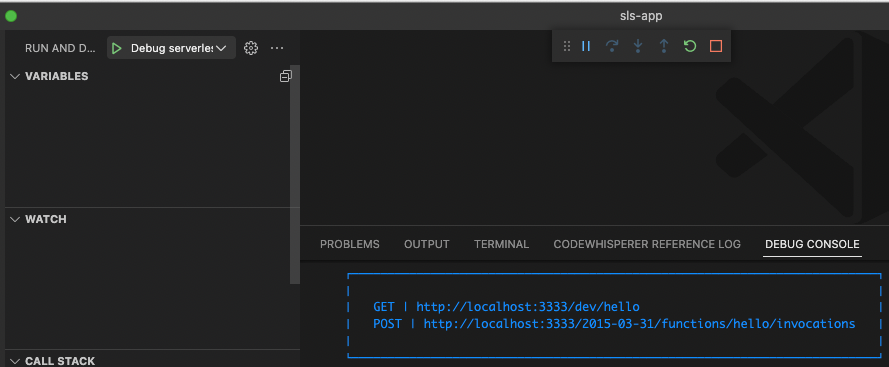
Nothing will happen until we hit our hello endpoint. Let’s open it in the browser by hitting the “http://localhost:3333/dev/hello” url. If you look into the VSCode debugger, you will see the same thing as you saw in the SAM example:
Conclusion
Congratulations, you have successfully set up the debugger for your serverless applications. If you were too lazy to follow along or want to compare notes, the full source code for both examples is available on GitHub.


%20(1).svg)

.svg)